
SYMPTOM 01
Chart production time
Each data change requires redrawing: bars, axis alignment and type sizes. A single chart can take about half an hour.
Enter data in a table, choose a chart type and colours, and generate an editable vector chart on an InDesign page. 21 chart types, six ways to get data in, live preview.
Sign-in is required to order; accounts can be created in the account centre. Current version and updates are available under “Check for updates” in the app.
Three common problems in book chart production.
Each data change requires redrawing: bars, axis alignment and type sizes. A single chart can take about half an hour.
Numbers are retyped from spreadsheets or read from screenshots, which is slow and prone to misalignment.
Books with dozens of charts end up with different colours, type sizes and label positions, requiring a final cleanup pass.
The result is grouped automatically, named after the chart title and undoable in one step; colours and positions remain editable in InDesign, and named paragraph styles can be bound.
Grouped and stacked columns, bars and stacked bars, pie, 3D pie, super-3D pie, doughnut, combo, dual-axis combo, Cupertino, area, line, smooth line, radar, treemap, waterfall, Mekko, bubble, Gantt and scatter.
Type it, paste/open/drag Excel, paste from the clipboard, capture the screen, OCR an image (screenshots, scanned pages, Chinese and English, decimals and percentages), or read the selected table directly from InDesign.
35 colour schemes and RGB/CMYK swatches, with optional binding to the document's own swatches; the whole configuration can be exported and imported.
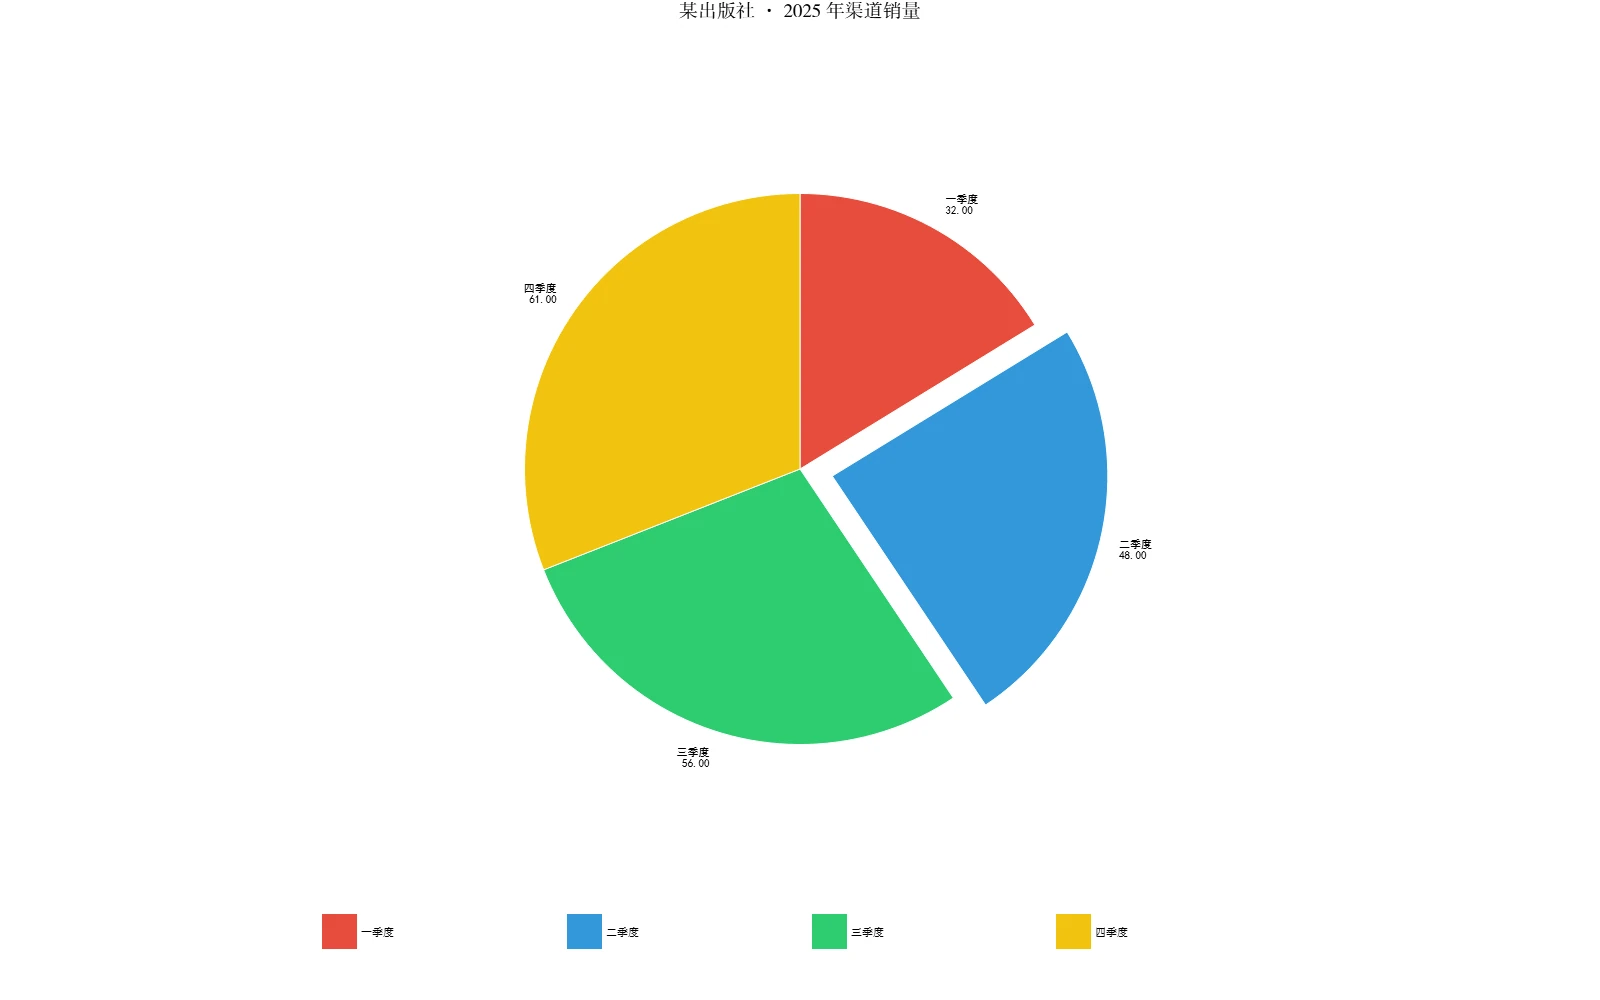
Live preview; negative values, percentages, unit scaling, label placement, percentage stacking, dual axes, exploded pie sectors, start angle and inner radius.
Export the current preview as a vector SVG for preview and presentation purposes; typeset-grade output is produced by InDesign.
Data entry on the left, table and live preview in the middle, parameters on the right; change the type or colours and the preview refreshes immediately.
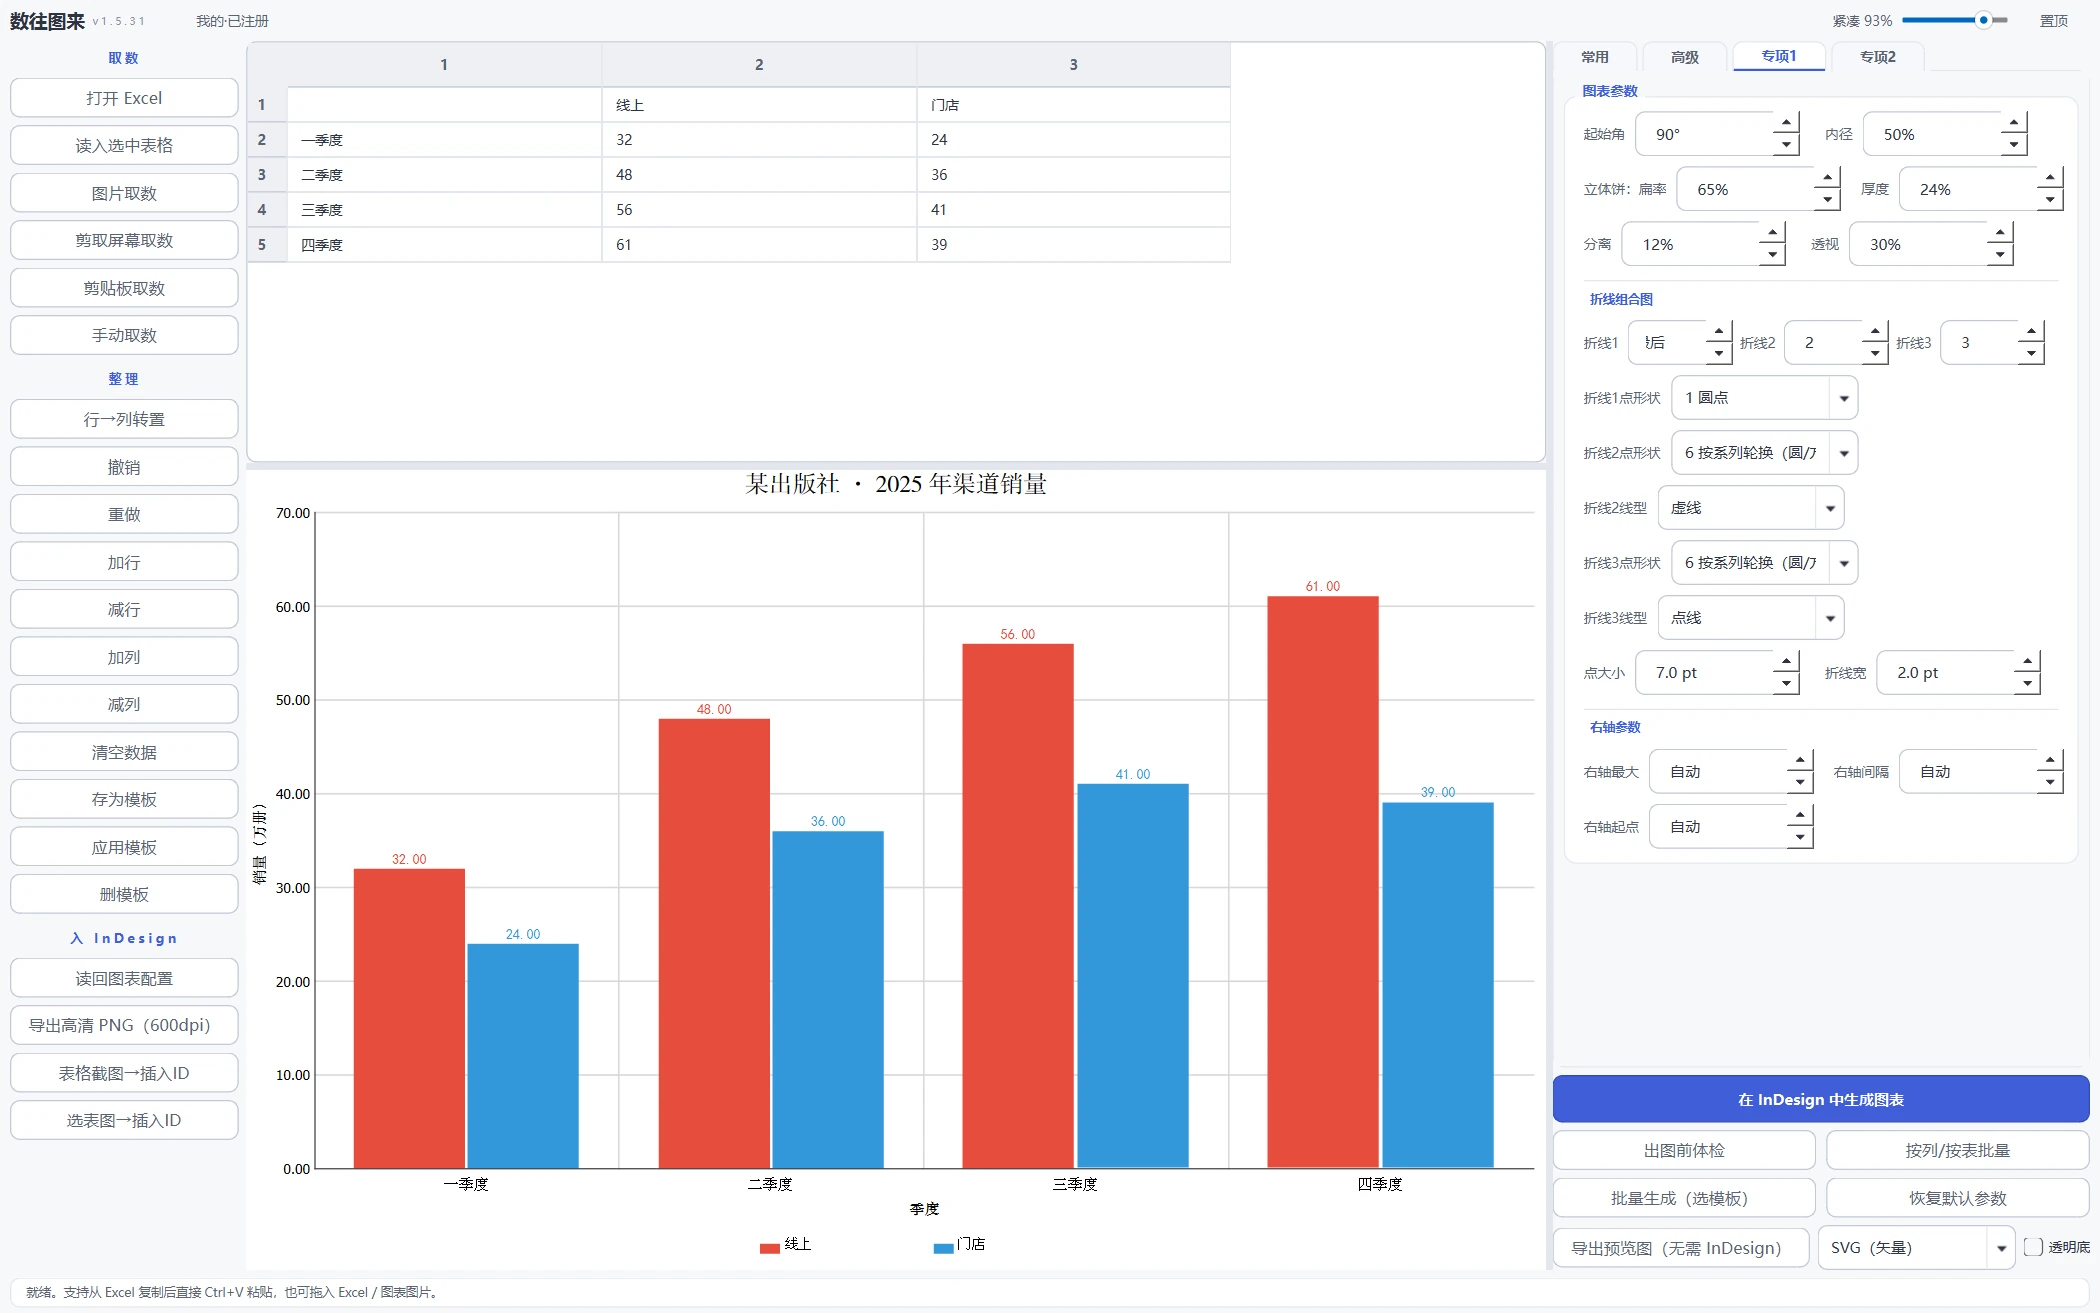
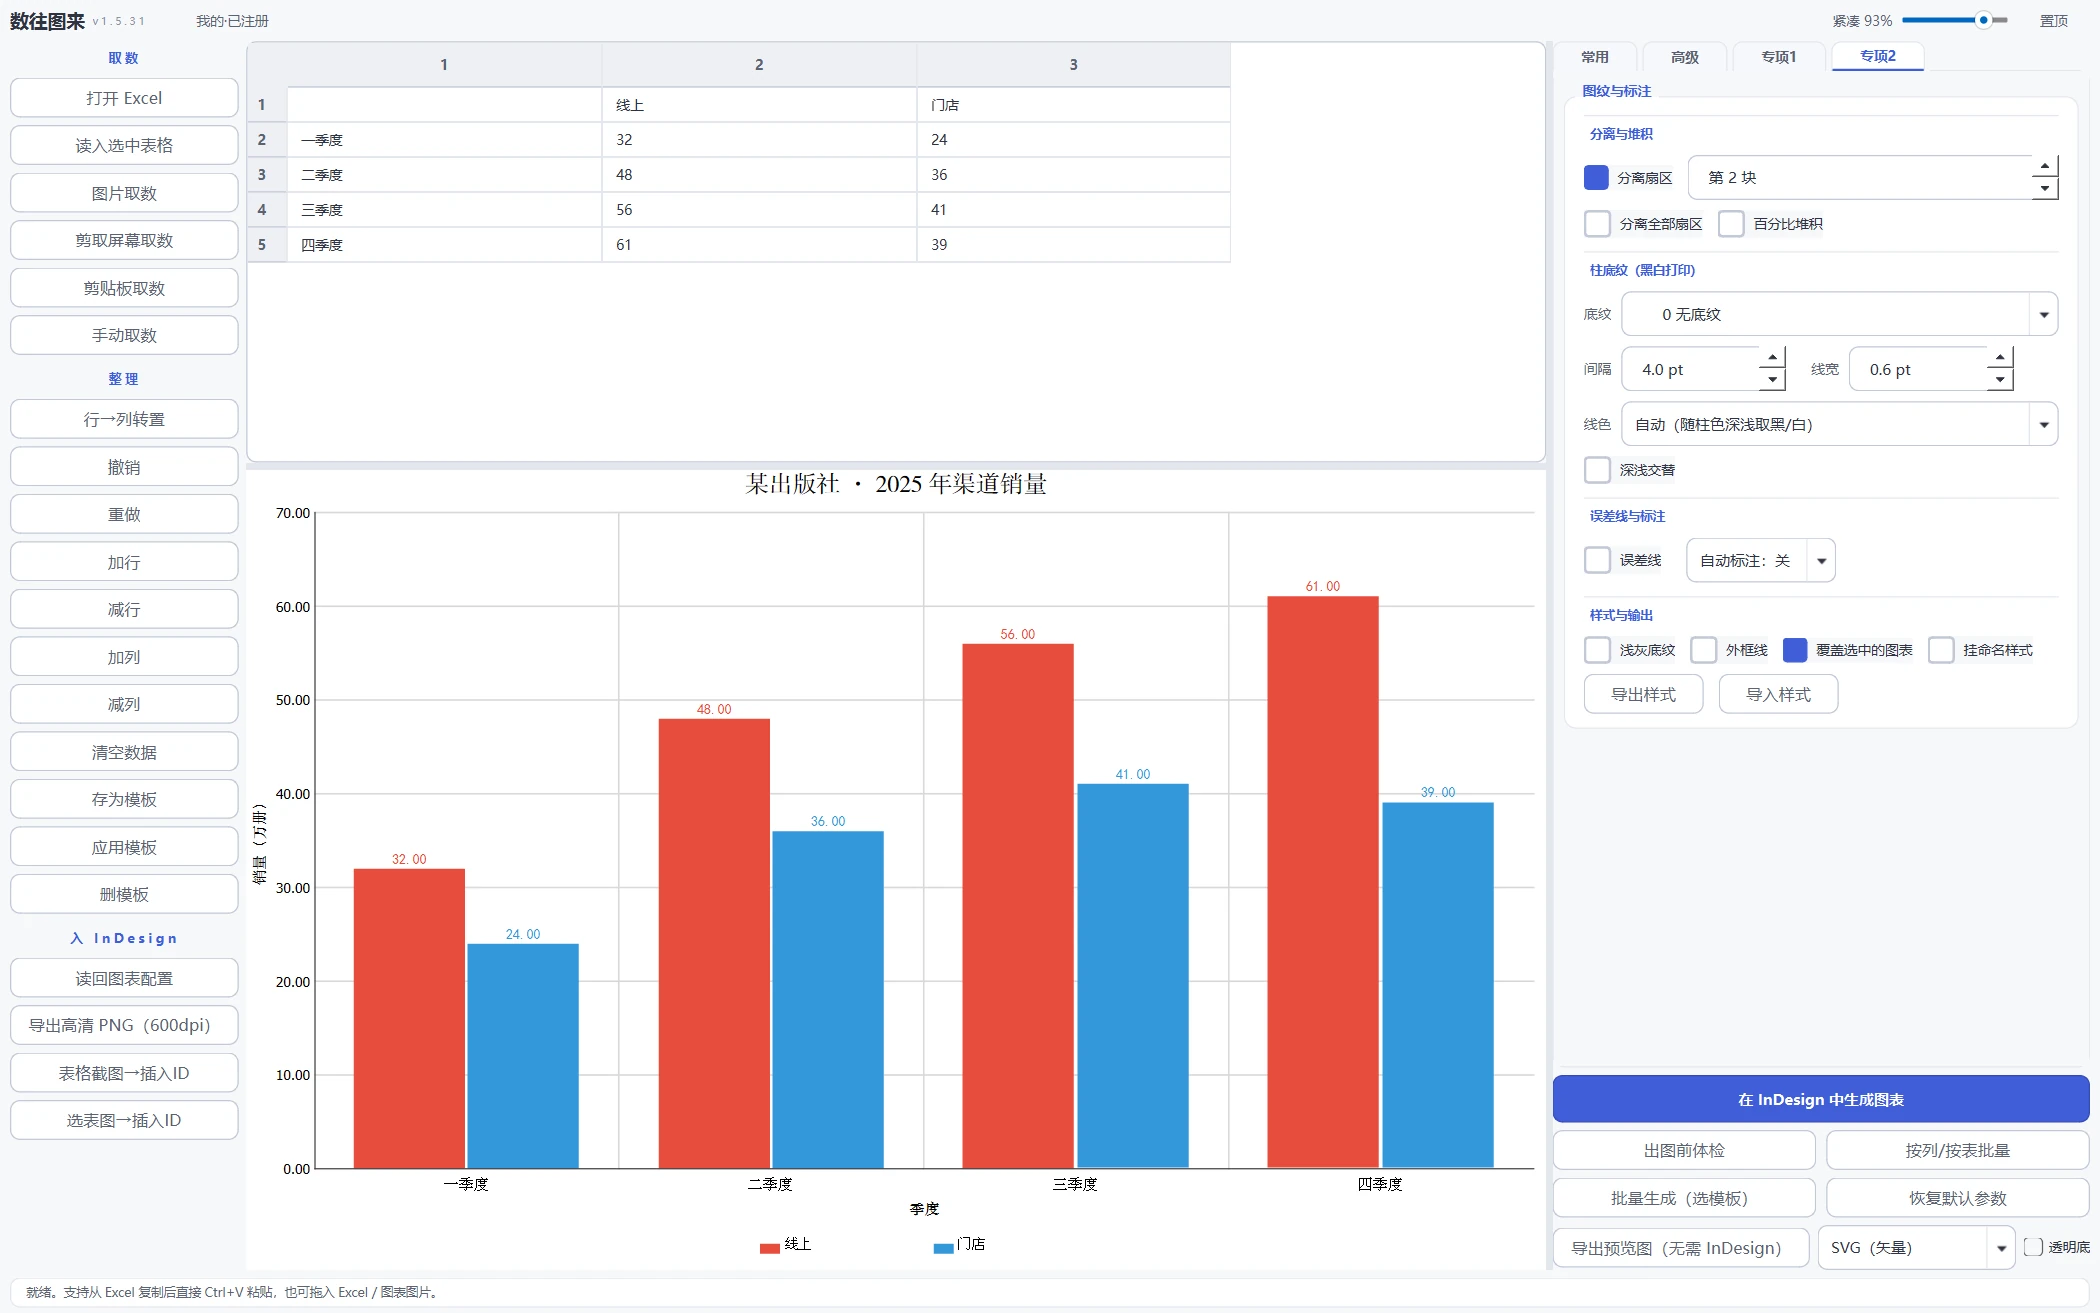
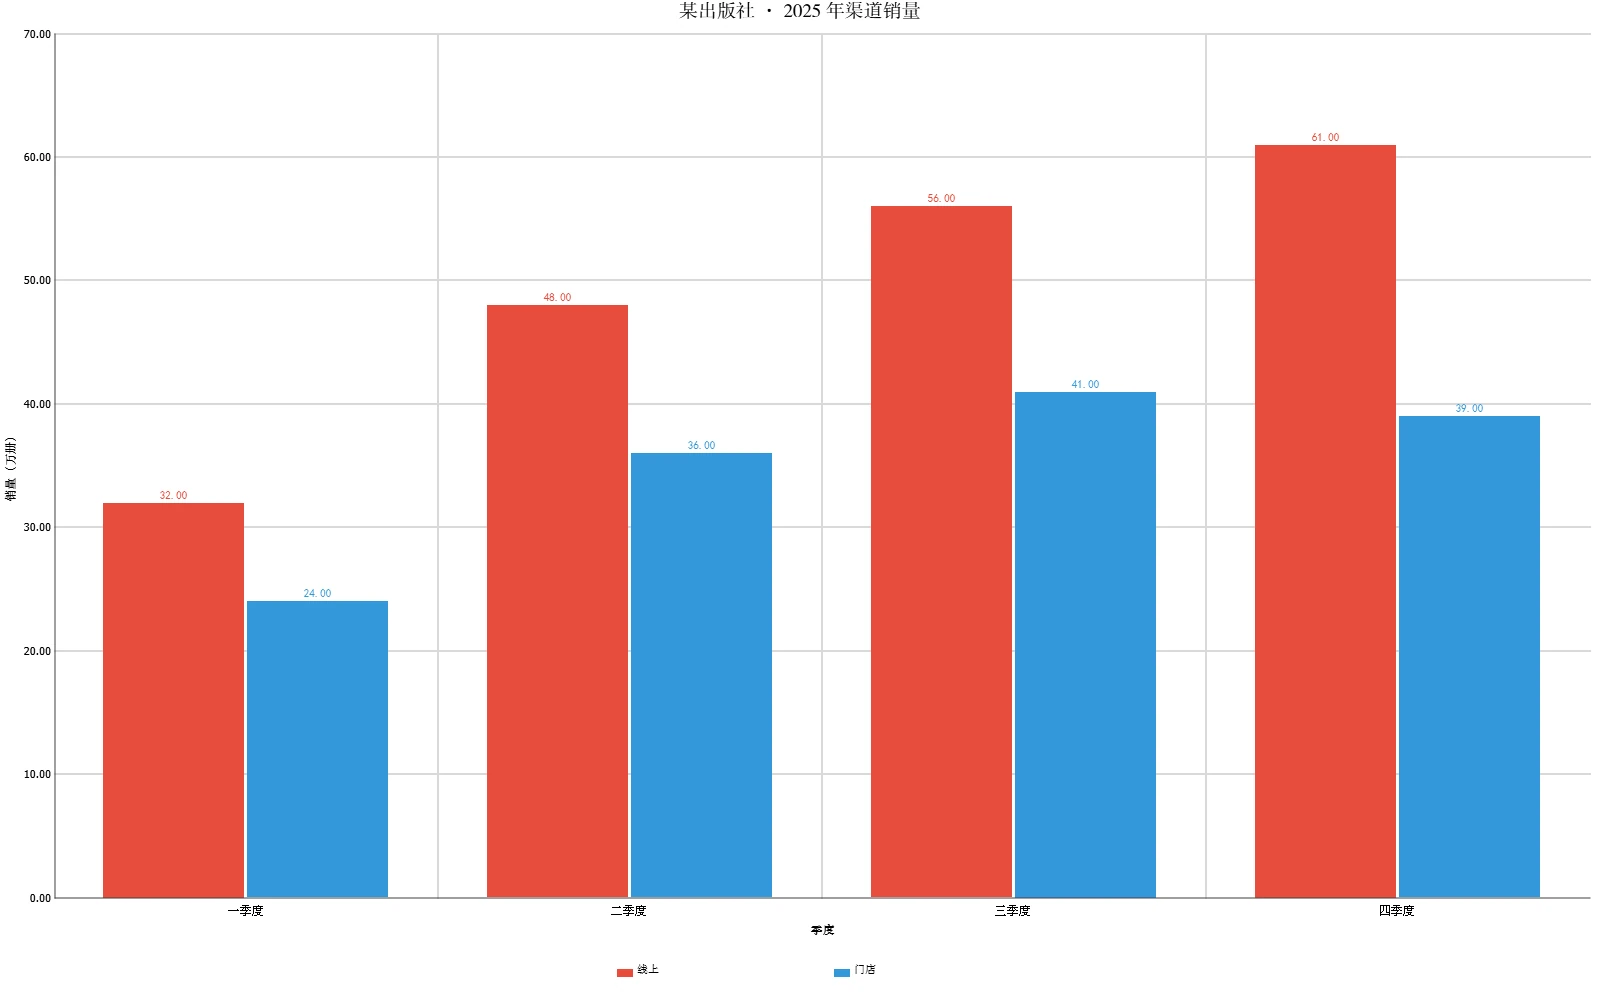
One sample dataset (a publisher's 2025 channel sales), rendered through the product's own export path; click any chart to open it full size.
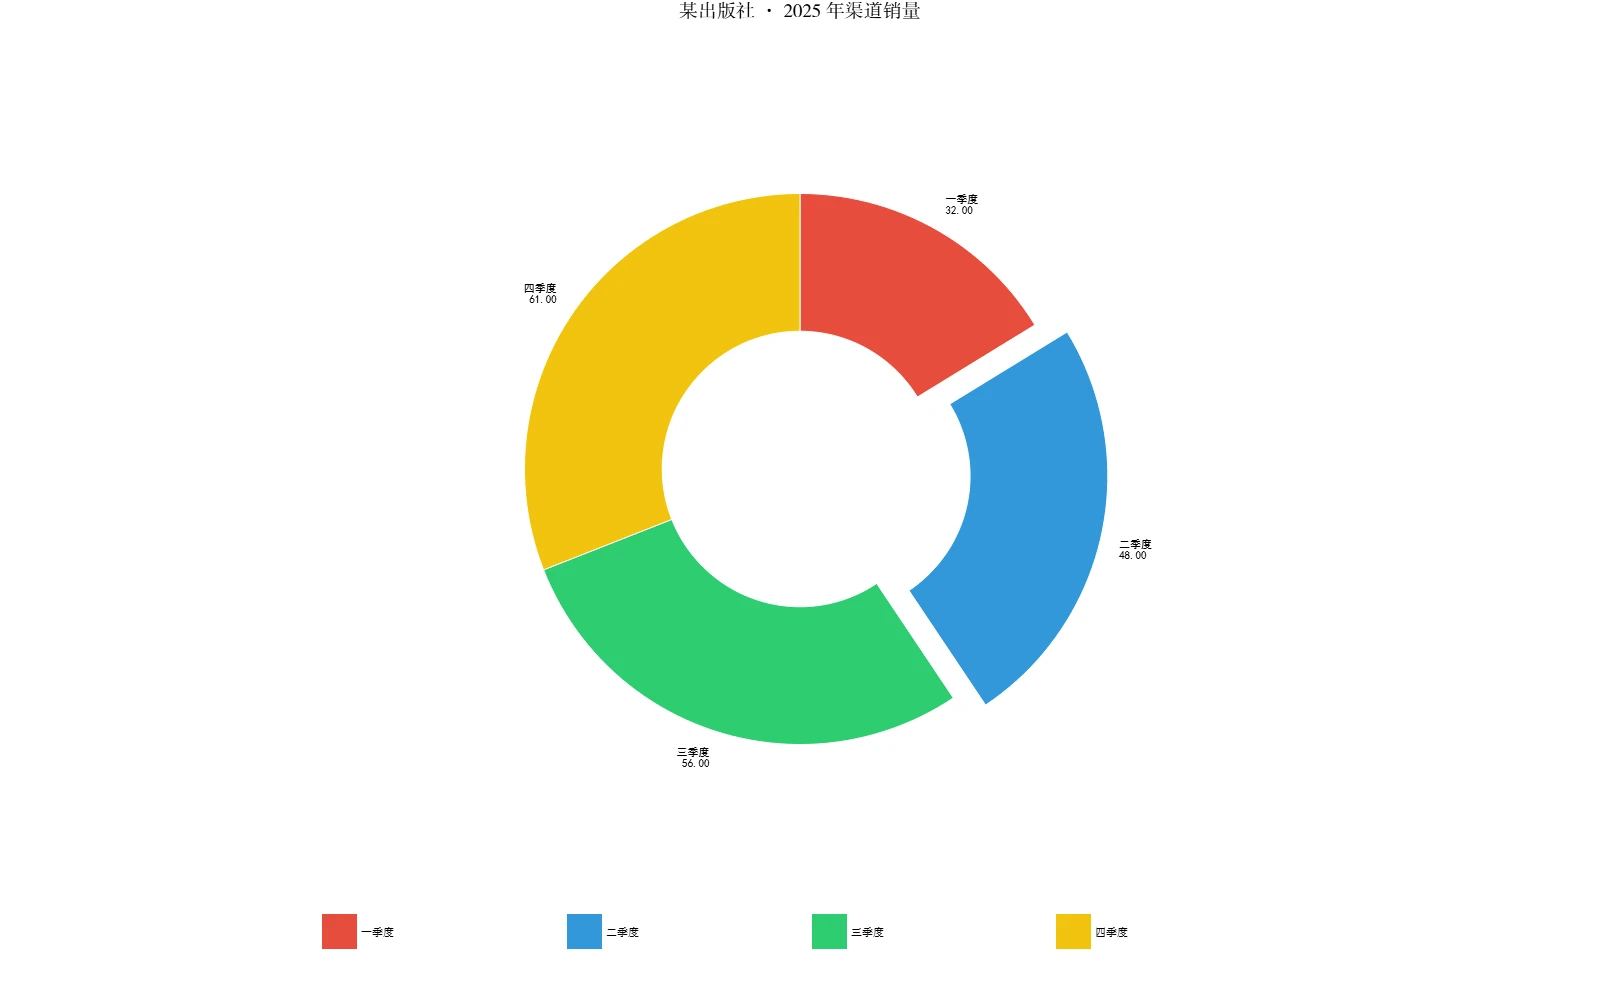
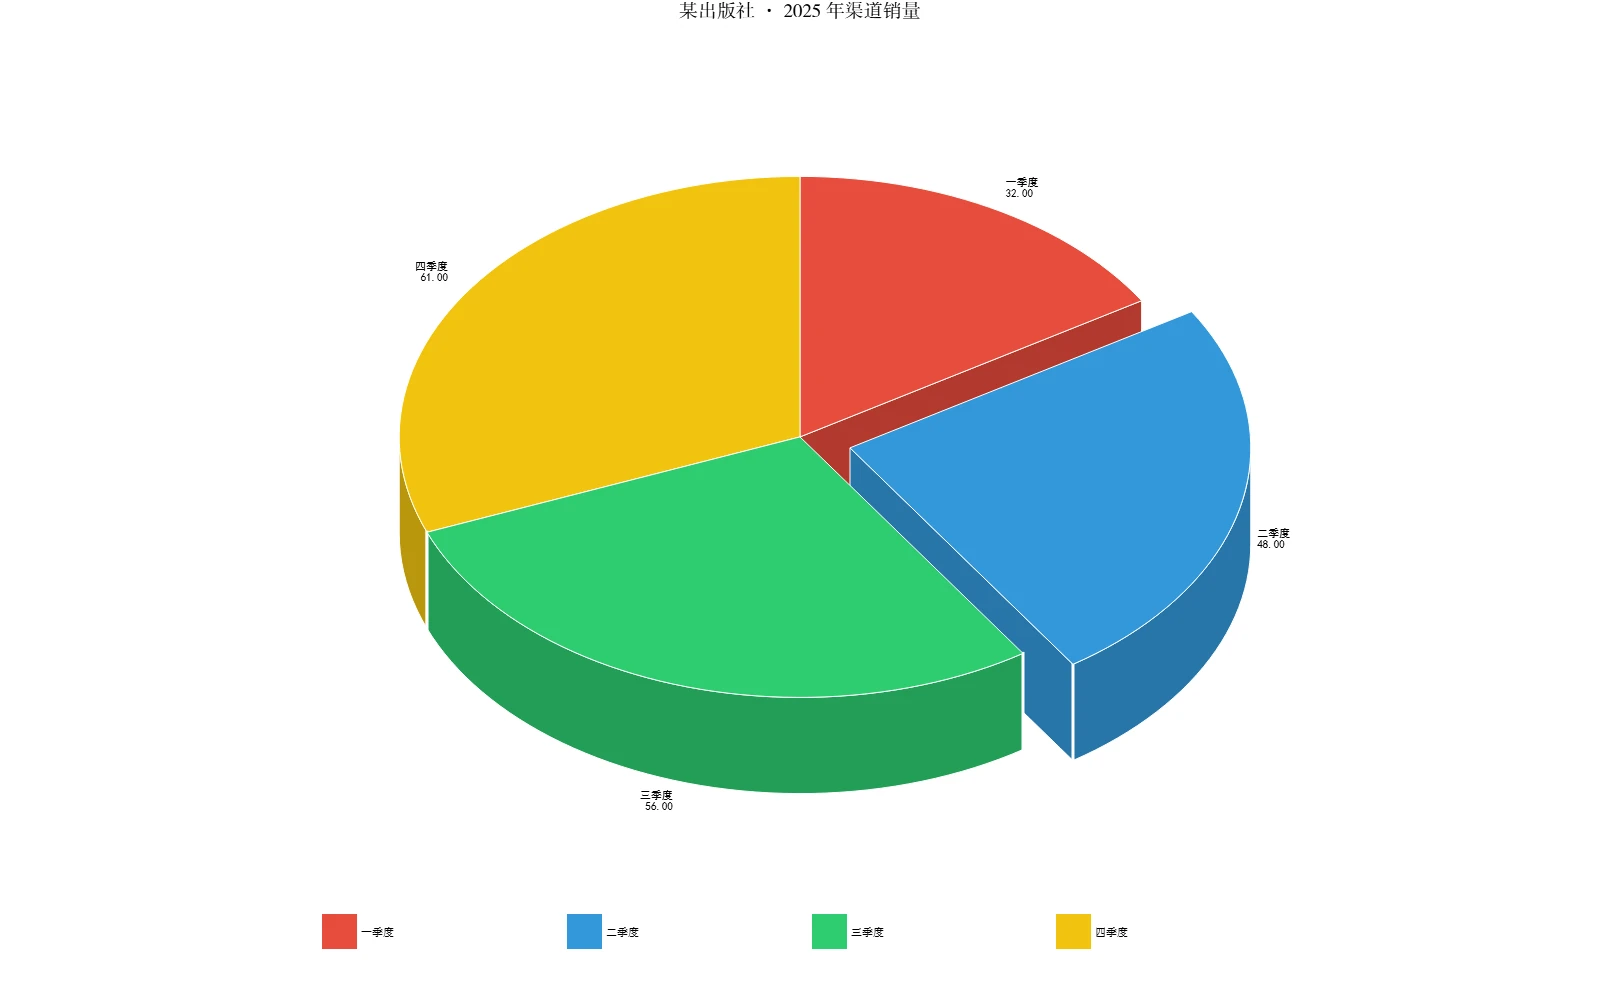
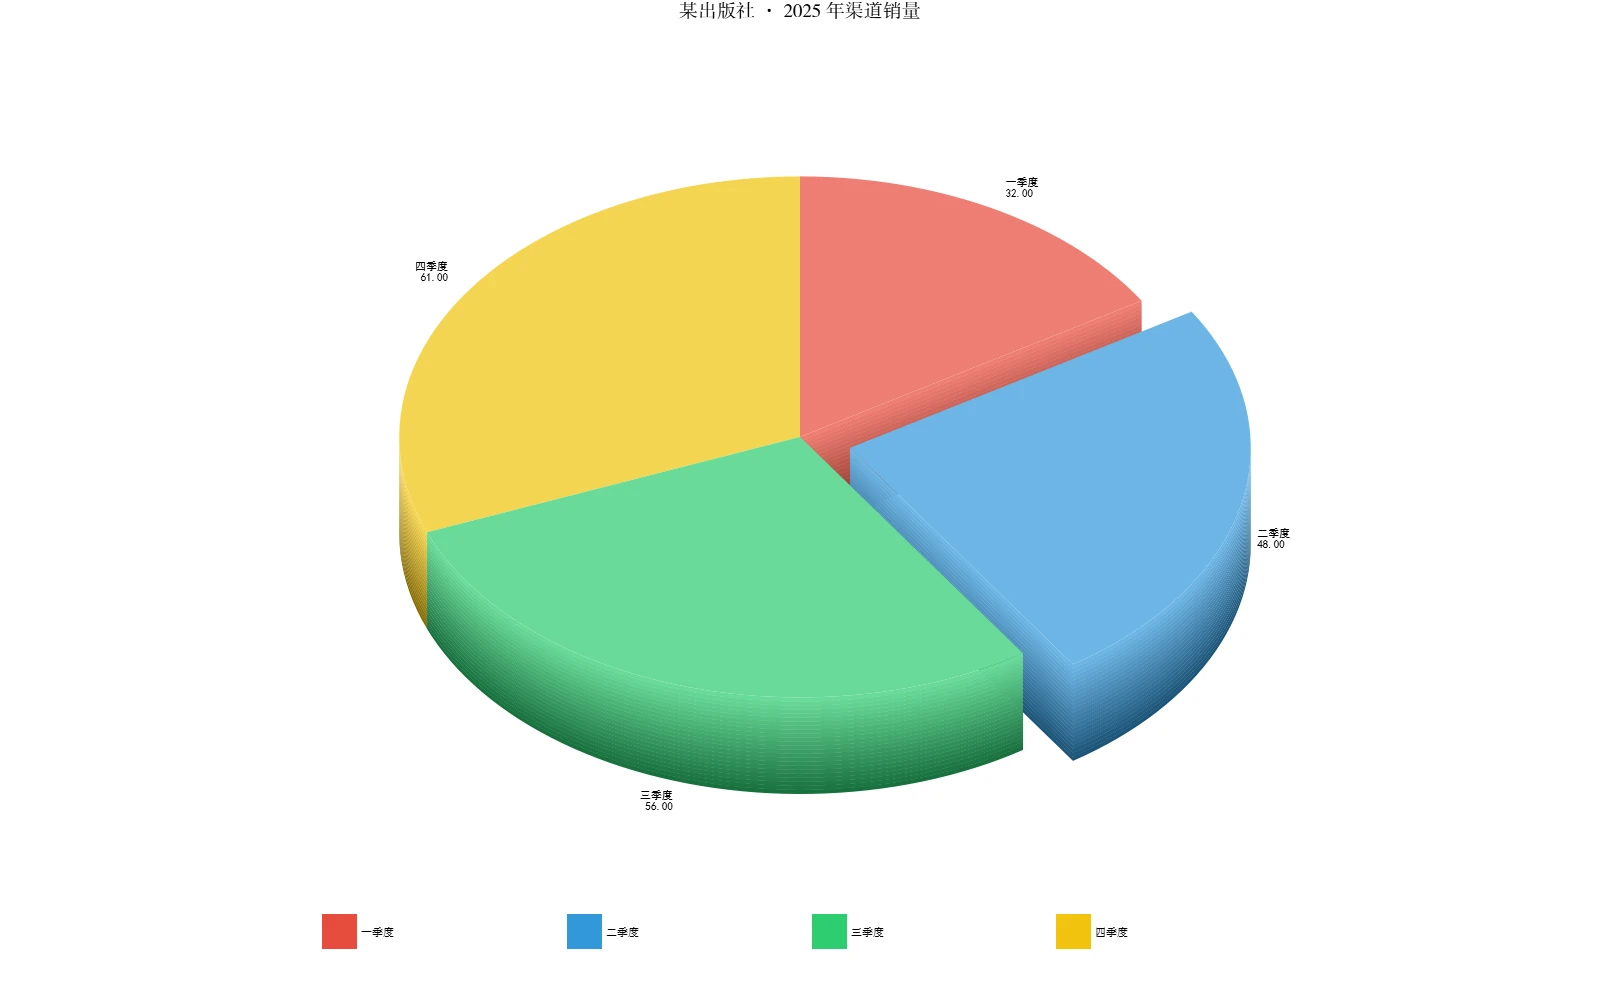
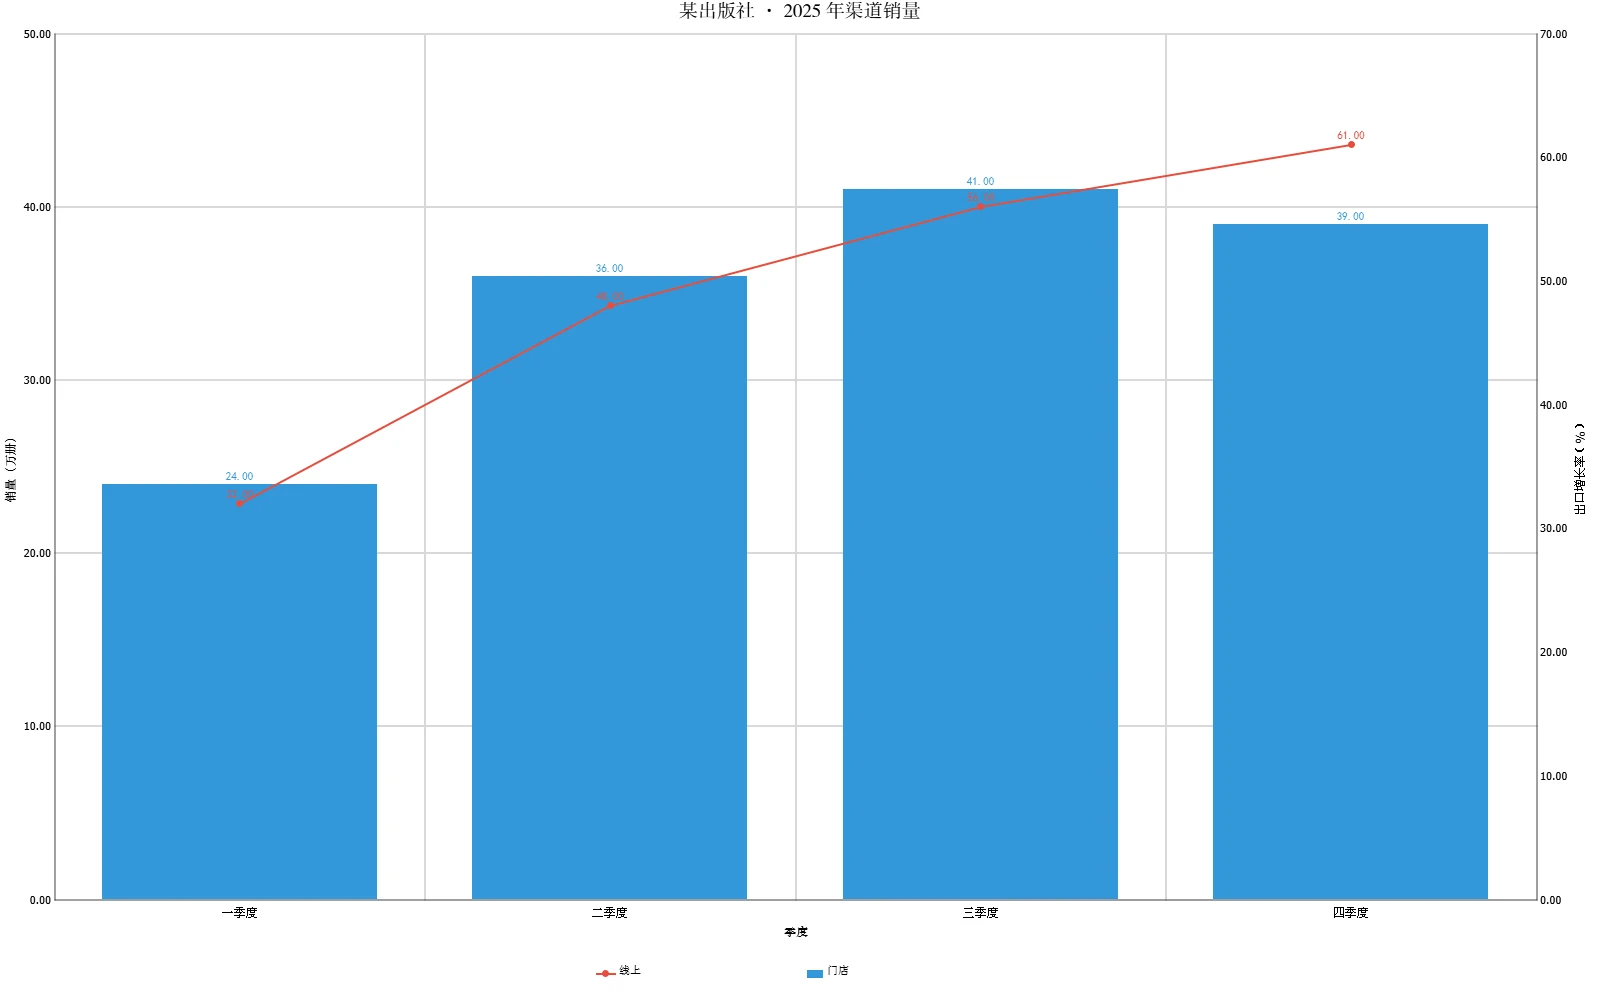
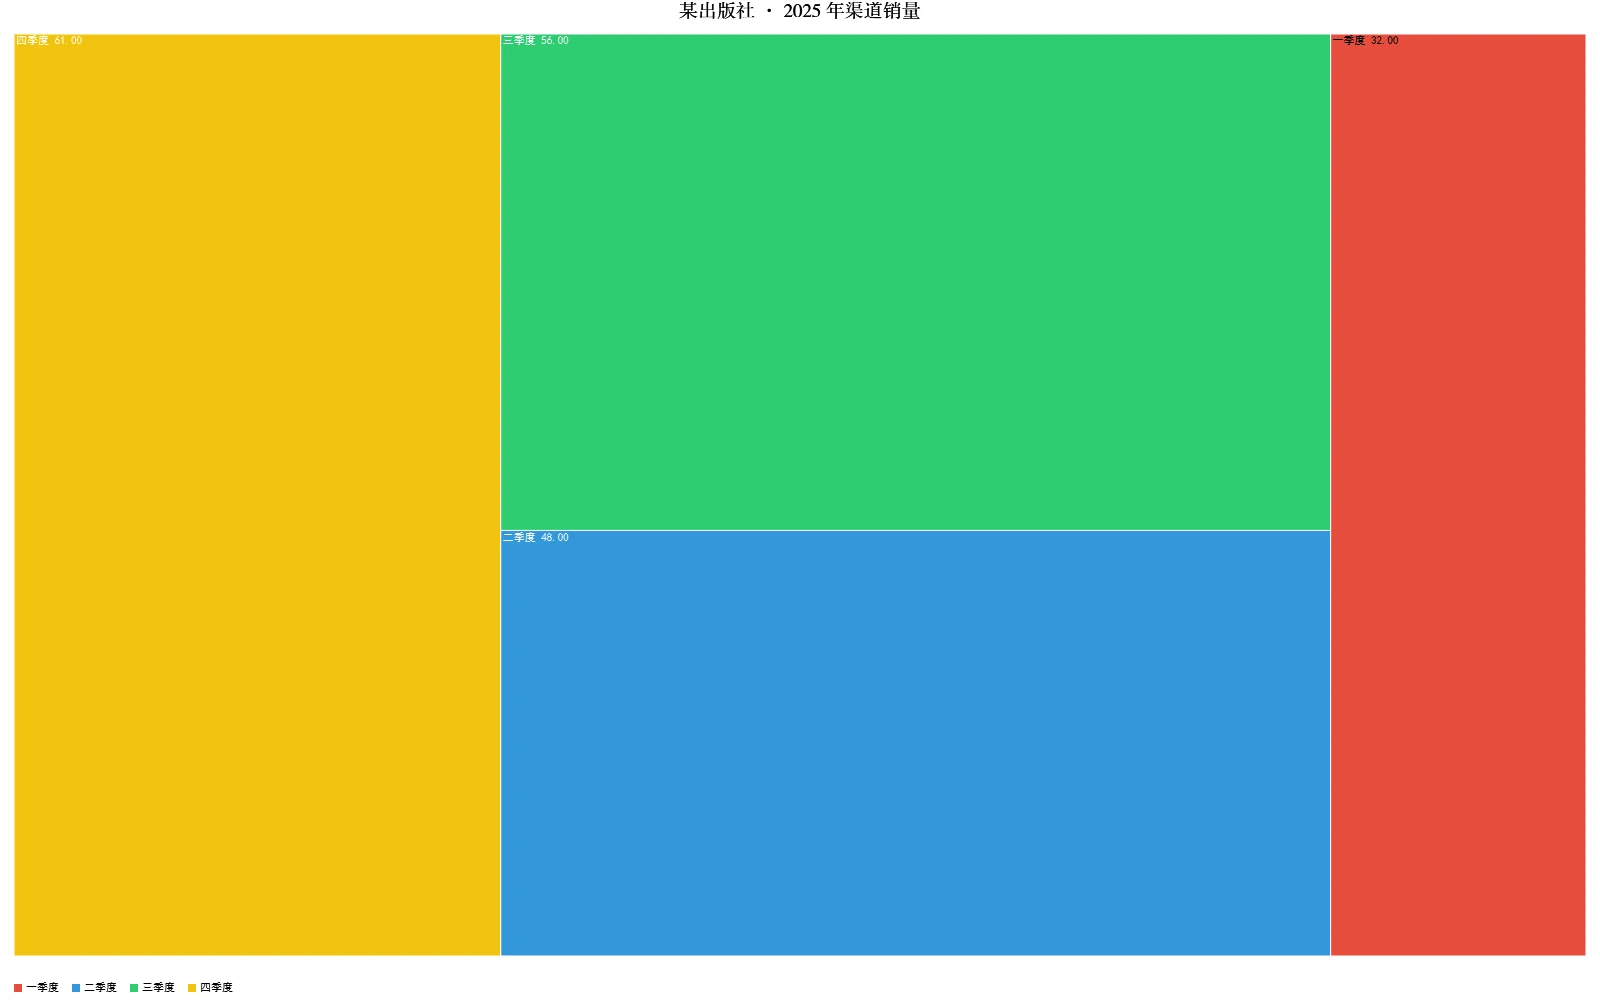
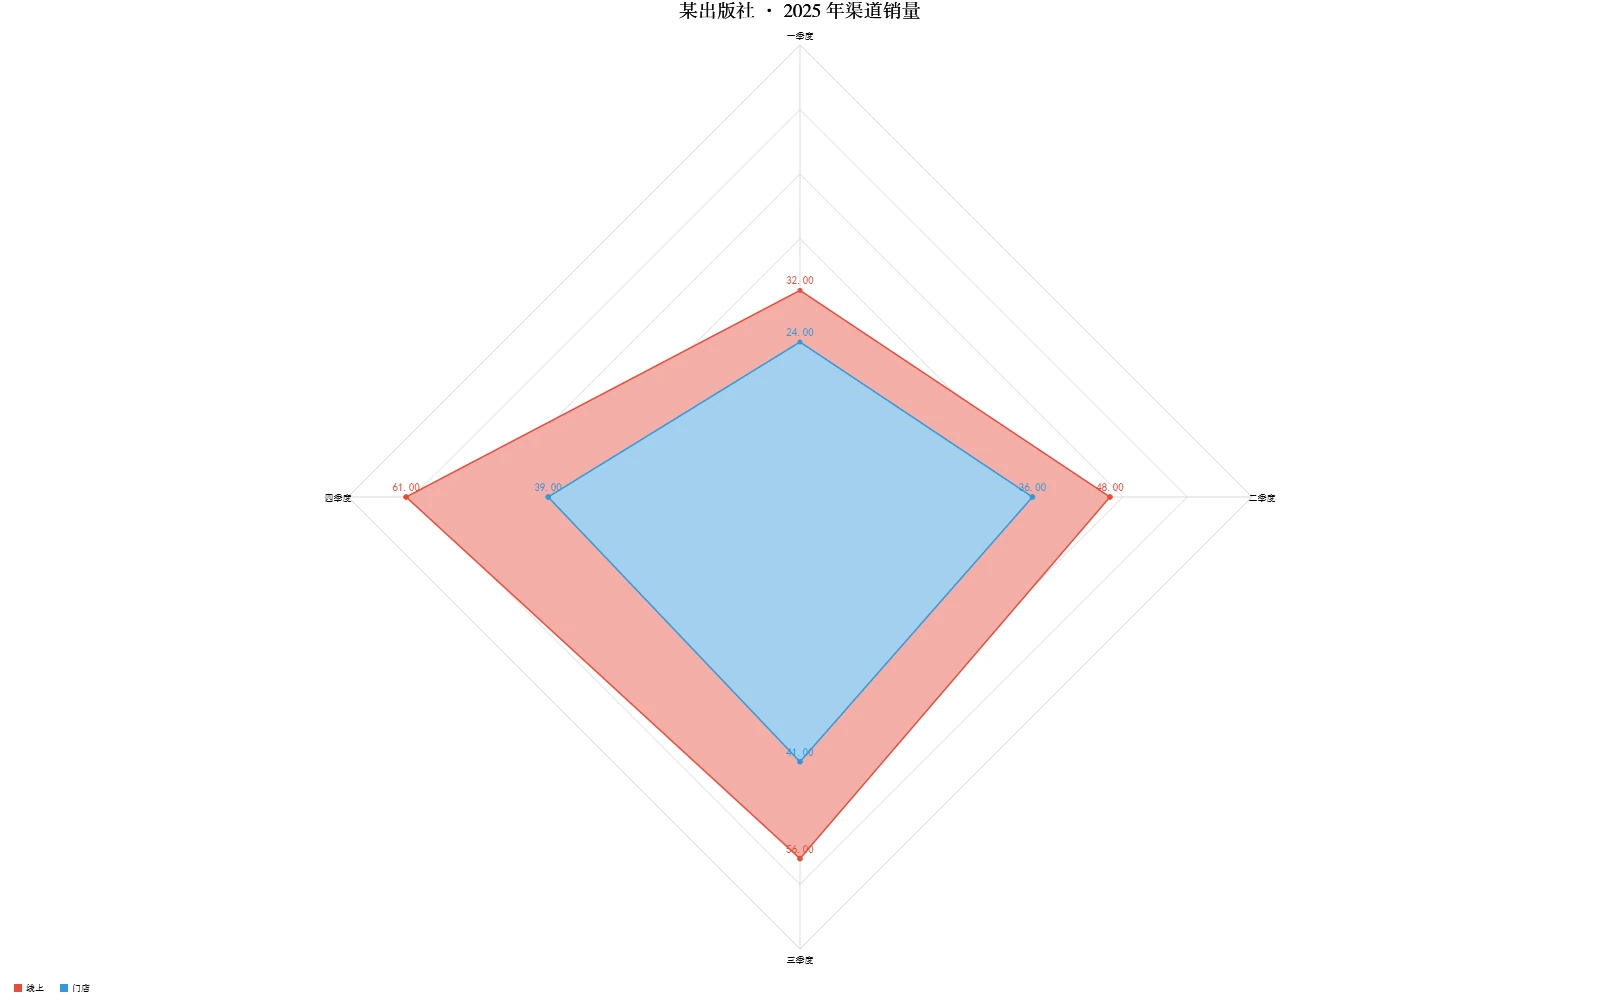
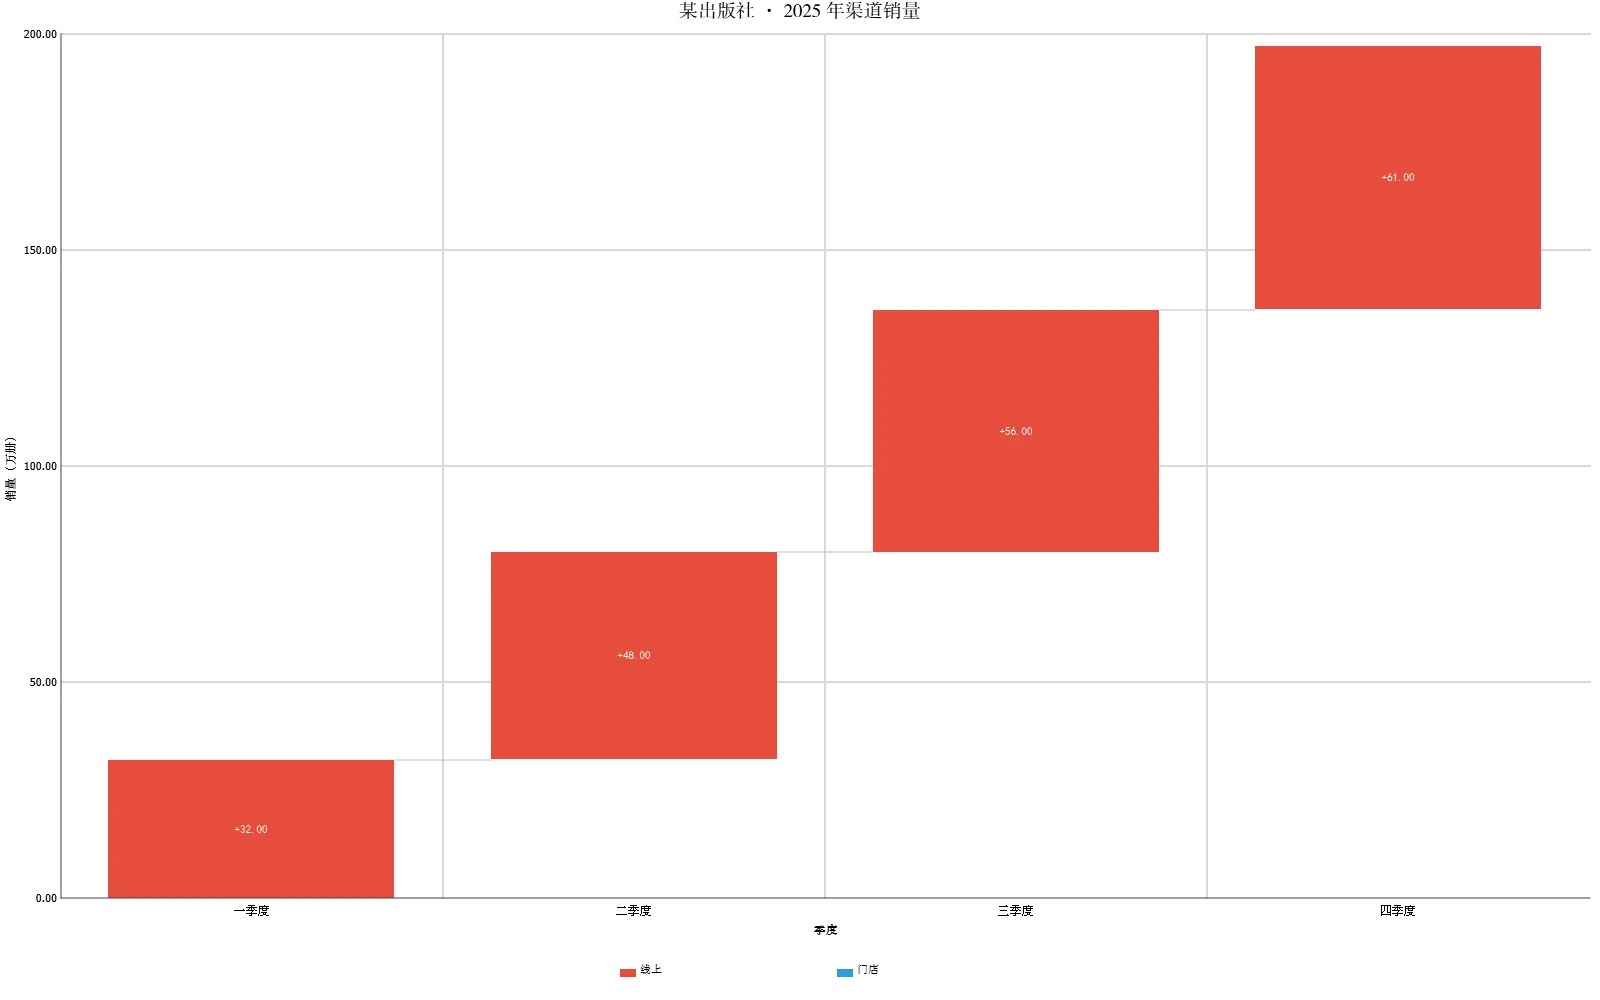
Four steps.
Six entry points: manual entry, Excel paste/open/drag, clipboard, screen capture, image OCR, or read an InDesign table.
21 chart types and 35 colour schemes; create RGB or CMYK swatches, or bind to the document swatches.
The preview refreshes on every change; labels, number formats, axis titles and dimensions are set in the same panel.
Open the target document and page, then generate; without InDesign, export an SVG.
Documented usage limits.
Image data capture and chart generation run locally; tables and manuscript content are never uploaded. The network is used only for licence checks and update checks.
Buy once, not per use.
One card binds one computer and remains valid after activation. Purchases made through an ANNOSYNC account can use “Rebind to this machine” on the new machine once every 30 days; the old machine loses authorisation on its next online check. Otherwise, unbind the old machine first, or contact support if it is unavailable.
New versions are checked at start-up with clear download and install prompts; a failed check while offline never stops the app from working.
When a build falls too far behind, start-up prompts for an update first; the exact rule follows the prompt inside the product.
Generating a chart requires InDesign 2025/2026 to be running with the target document open. Without InDesign, the current preview can be exported as a vector SVG.
Six options: manual entry, Excel paste/open/drag, clipboard, screen capture, image OCR (screenshots, scanned pages, Chinese and English, decimals and percentages), or direct reading of a selected InDesign table.
Charts on an InDesign page are native vector objects, grouped automatically, undoable in one step, and remain editable for colour, position and style.
The download is available immediately after payment and can be retrieved again under Account → My tools.
Purchases made through an ANNOSYNC account can be rebound on the new machine once every 30 days; the original machine loses authorisation on its next online check. Without an account, or where the original machine is still available, unbind the original device first and then enter the card key on the new device.
Perpetual licence · one machine per card · automatic updates
 Beijing Public Security Filing 11010502063040·Privacy·Terms of Service·Legal Notice